
-
Benchmarks
-
Charts
- Annual Performance Chart
- Asset Allocation History (Chart)
- Asset Class Exposure
- Consecutive Gains (Losses)
- Correlations (chart)
- Cumulative Returns (Equity)
- Displaying amounts/labels in charts
- Distribution of Monthly Returns
- Distribution of Quarterly Returns
- Distribution of Rolling Annual Returns
- Drawdown chart
- Dynamic and Interactive charts
- Excess Returns Charts and Tables
- Geographic Exposure
- Holding Period Exposure
- How to long, short, and net positions in a chart
- Market Cap Allocation
- Monthly Returns
- Portfolio Composition Chart
- Return (Performance) Contribution
- Return Report
- Risk Rating
- Risk/Return Chart
- Scatter plot (Manager Consistency)
- Strategy Exposure
- Style Analysis (Chart)
- Up/Down Capture vs. Benchmark
- Up/Down Market Outperformance (Chart)
- VAMI chart
- Volatility chart (12 months rolling)
-
Company Information
-
Data Import
- Available fields for Mass Portfolio Composition Import
- Creating Import file / Mass import file
- Import performance data for multiple programs
- Import Sector Allocation History
- Most common mistakes when importing data.
- Set Auto-import
- Total Mass Import
- Update and import fund terms
- Update and import performance data for a single program
- Update and import portfolio composition
- Update or import your data
- Use FTP to update my factsheets
- Using Excel AutoFill for dates
-
Factsheet Publishing
-
Factsheet Templates
-
Fundpeak API
-
Other
- Add new programs
- Adding Google Analytics tracking code
- Adding images to articles
- Articles
- Articles - Inteligent
- Avoid Formatting Issues When Copying Content
- Basic tutorial video how to use TopSheets
- Change password
- Checking HTML code
- Client Portal
- Copy a program
- Create factsheets in multiple language versions
- Delete data
- Difference between programs and portfolios
- Disable new device sign up alert
- Export Fund Terms / Links to all reports
- Financial Data
- Invoice or receipts
- Leverage in Portfolio
- Login Attempt Limit
- My program doesn't show up in the TOP 10 tables.
- Organize factsheets into folders
- Paragraphs vs Line breaks
- Points vs commas
- Portfolio holdings and allocation templates
- Program and template adjustments
- Refer our service
- Save changes made to custom template
- Save credit cards for next payments
- Save your Factsheet
- Set up your custom domain name
- Two-factor authentication (2FA)
-
Performance Data
- Displaying daily data in default templates
- Highlight estimates in performance table
- How to display live and backtested results in a single table or chart
- How to display net and gross results in a single factsheet
- Update and import AUM data
- Update and import performance data for a single program
- Update or import your data
-
Portfolio Composition
-
Portfolio Tool
-
Program Information
- Abbreviate large numbers in the General Information table
- Advisor fees in Program
- Change administrator
- Change program name
- Create multiple factsheet versions with Fund Classes
- Custom Fields
- Delete Programs
- High-water Mark
- I cannot find where to fill some fields displayed in my template
- Notional Funding
- Program identifier
- Restore archived factsheets
- Short program name in charts and tables
- Templates for Forex
- The License Number is not displayed properly
- UCITS SRRI
- Update and import fund terms
- Update disclaimer
- Update programs content
- Update the Fund Manager section in your template
-
Statistics
- 12 Months ROR
- 3 Months ROR
- 36 Months ROR
- Active Premium
- Alpha
- AUM Gains
- Average AuM
- Average Losing Month/Quarter
- Average Market Net Exposure
- Average Positive Month/Quarter
- Average ROR
- Best Year / Best Positive Year
- Beta
- Calculate net returns / Include fees into results
- Calculate the non compounded Drawdown
- Calmar Ratio
- Correlation and Correlation Coefficient
- Correlation to negative months
- Correlation vs net/gross returns
- Current Drawdown
- Difference between compounded and non compounded rate of return
- Downside Correlation
- Downside Deviation (Semi Deviation)
- Drawdown Report
- Excess Returns
- Export statistics to Excel
- Gain Standard Deviation
- Hide statistics without values
- Highest/Lowest Annual Return
- How to manually update statistics values
- Inception Date
- Information Ratio
- Jensen alpha
- Kurtosis
- Last 3/6/12/36/ Month Return
- Last 30/60/90/120/150/360/365 Days
- Last 36 Months Average
- Last Month
- Last Quarter
- Loss Standard Deviation
- Max AuM
- Max Drawdown Valley Date
- Maximum Drawdown
- Maximum Upside
- Month To Date (MTD)
- Monthly / Annualized Rate of Return (RoR)
- Monthly Drawdown
- Negative Months (%)
- Negative Year / Worst Negative Year
- Number of Months Fund Outperforms
- Number of Years
- Omega Ratio
- Percent Outperformance
- Positive months (%)
- Price/Book Ratio
- Price/Earnings Ratio
- Quarter To Date (QTD)
- R Squared
- Rachev Ratio
- Rate of Return
- Risk Adjusted Returns
- Risk-free rate
- Sharpe Ratio
- Sharpe Ratio Simple
- Since Inception to Last Quarter Return
- Skewness
- Sortino Ratio
- Standard Deviation (Volatility)
- STARR Performance
- Sterling Ratio
- Switch between compounded and non-compounded calculation
- Time Window Analysis
- Total Return
- Tracking Error (Active Risk)
- Treynor Ratio
- Upside/Downside Capture
- Value Added Monthly Index (VAMI)
- Value at Risk
- Which risk-free rate of return (RFR) do you apply for the calculations?
- Winning / Losing Months
- Winning 12M Rolling (%)
- Year To Date (YTD)
- Yearly Drawdown
- Yearly Returns
- Yield to Maturity (YTM)
-
Tables
-
Widgets
Update and import portfolio composition
Portfolio composition data can be updated manually or imported from an Excel file.
1. Manual input
Use this option when you want to update portfolio composition data directly for one specific program.
Select the program in the left-hand panel. Then open Portfolio Composition in the right-hand panel.
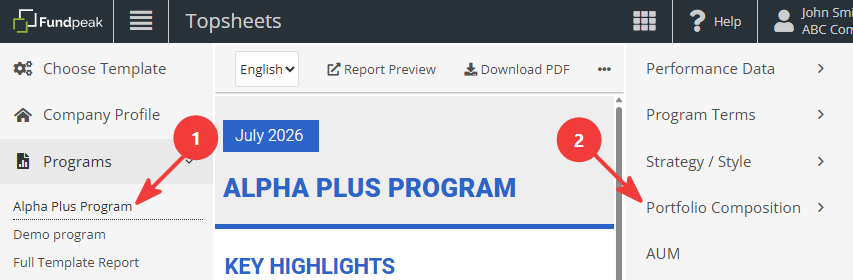
Select the required section, update the required values, and click Save.
2. Prepare and upload an Excel file
Portfolio composition data can also be imported using the Mass Portfolio Composition Import tool. This can be used to update either a single program or multiple programs at once.
If you are not familiar with mass imports, see Import performance data for multiple programs for information about preparing the file, selecting import options, validating the data, and running the import.
2.1 Prepare the import file
Please note that the Portfolio Composition import file uses a different structure from other mass imports. Program codes are listed at the beginning of each row rather than at the top of each column.
We recommend starting by downloading the sample file available on the Mass Portfolio Composition Import page.
The main columns are:
- Code – must contain a unique program identifier. See Creating Import file / Mass import file for more information.
- Category – specifies the Portfolio Composition section where the data will be imported. Possible values include Stock Sectors, Futures Sectors, REIT Sectors, Other Sectors, Investment Exposure, Geographic Exposure, Geographic Exposure Regions, Market Cap Exposure, Credit Rating, Instruments, Top Instruments, and ESG Score.
- Field – specifies the individual item within the selected category, for example a sector such as Energy, a rating such as AA+, or a country such as United Kingdom.
- Value – the numeric value for the selected field. Enter the value as a number, not as a percentage.
- Date – use this column to import historical values. If the Date cell is empty or the Date column is omitted, the data will be imported as current values.
See Available fields for Mass Portfolio Composition Import for more information, or refer to the Mass Portfolio Composition Import sample file for examples.
Related topics
Import performance data for multiple programs
Creating Import file / Mass import file
Available fields for Mass Portfolio Composition Import