
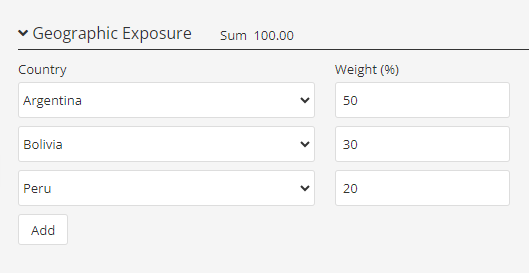
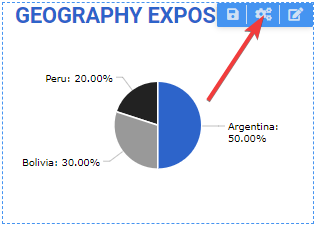
The chart shows the geographic composition of investments in a portfolio. The data can be entered under Portfolio composition / Geographic exposure.
The type of chart (pie/donut), columns to be displayed (weight/long/short) and other settings can be adjusted using the “edit settings” icon.
Continue your fund reporting workflow
This feature supports consistent fund performance reporting and automated factsheet updates. Continue with Add and configure statistics and Fund factsheet production software.