
Use the Statistics table to show performance and risk measures for a program and compare them with selected benchmarks.
Add and arrange statistics
- Move your mouse over the Statistics table in the report preview and click Edit settings.
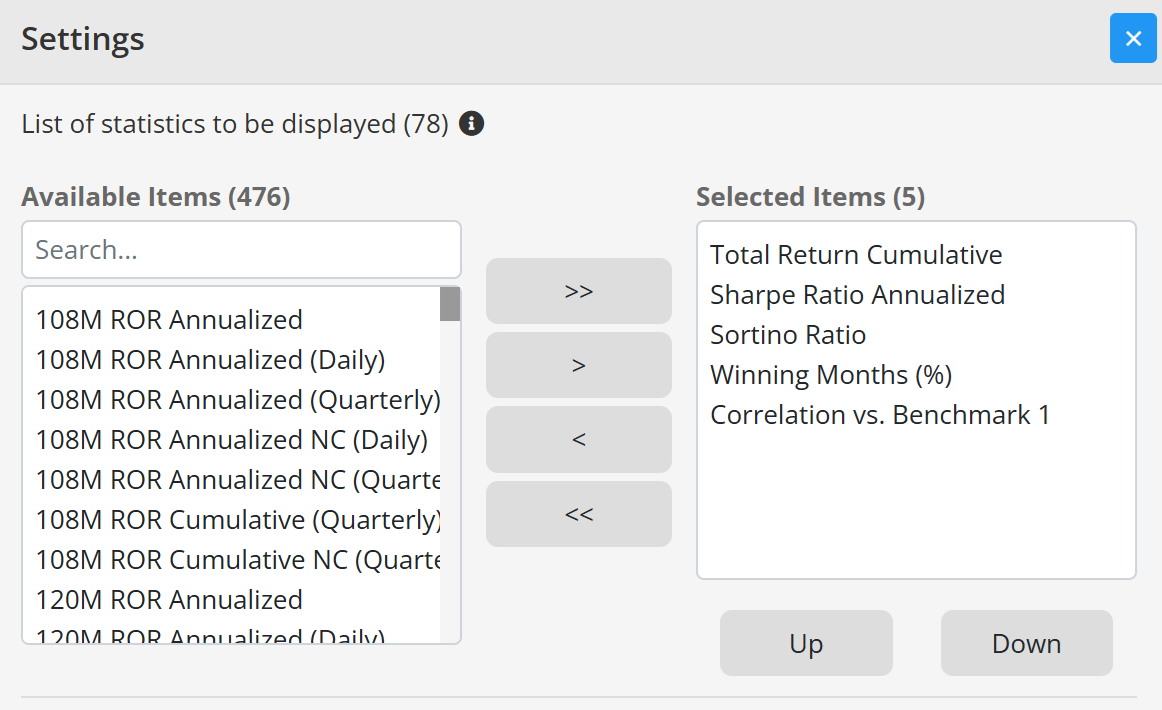
- In List of statistics to be displayed, move the required statistics from Available Items to Selected Items.
- Use Up and Down to arrange the selected statistics.
- Save your changes.
Statistics are available in monthly and quarterly variants. Daily variants are also available for supported statistics. Choose the variant that matches the return frequency used by the program.
Add benchmarks
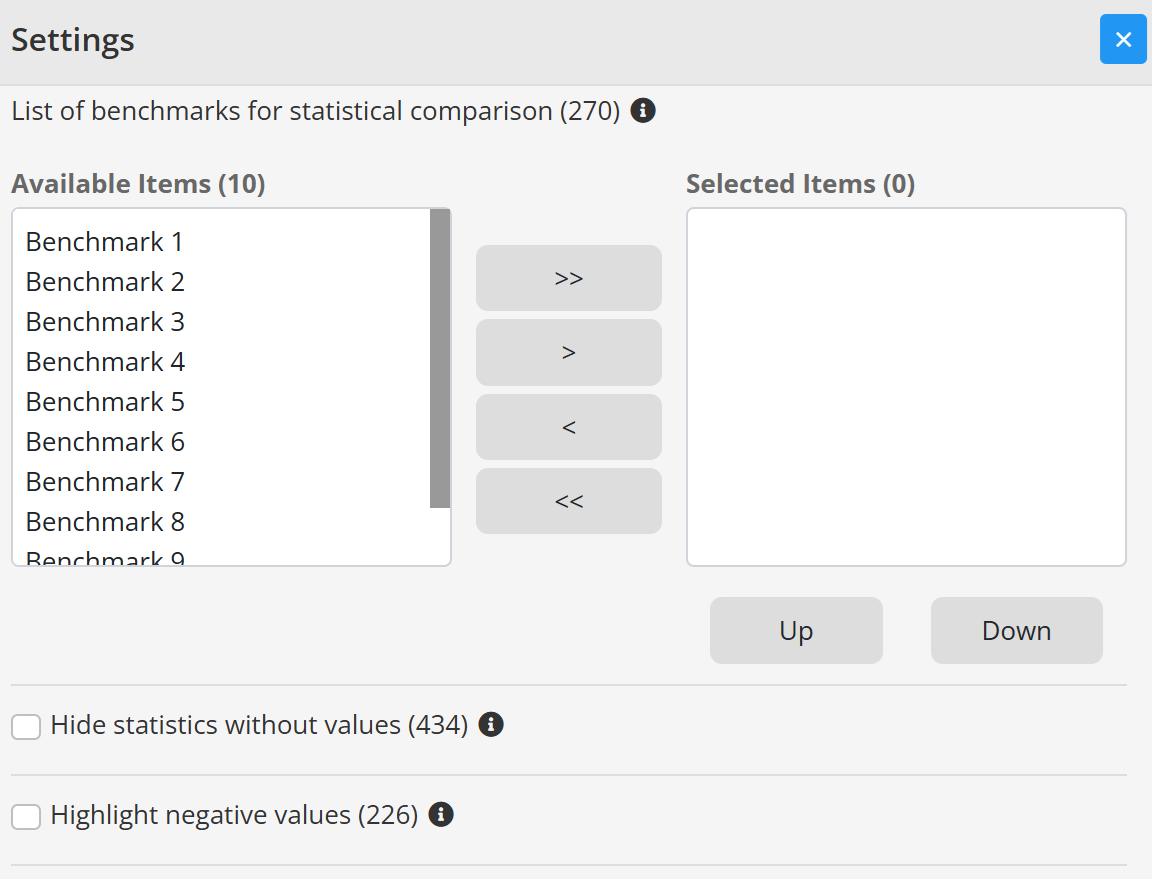
In List of benchmarks for statistical comparison, select the benchmarks you want to display. Benchmark values are shown in additional columns next to the program values.
Enable Hide statistics without values to omit individual rows when no value is available. You can also enable Highlight negative values when required by the template.
Display the table
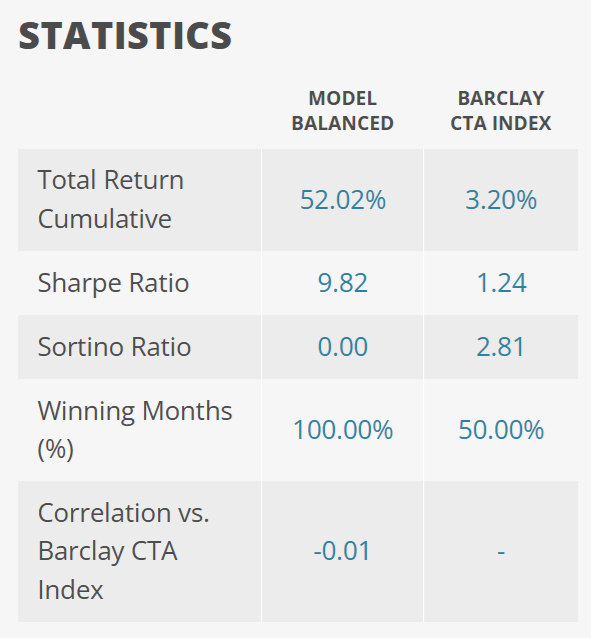
The configured table displays the selected statistics for the program and each selected benchmark.
Hide the entire table when it has no data
Selected tables and charts can be hidden automatically when no data is available. Open Edit settings for the widget, enable the option to hide the widget without data, and save your changes.
The empty widget remains visible and dimmed in the Template Editor and report preview so that it can still be edited. It is hidden completely in the published report.
Related topics
Dynamic labels for benchmark statistics
Factsheet template customization
Continue your fund reporting workflow
This feature supports consistent fund performance reporting and automated factsheet updates. Continue with Add and configure statistics and Fund factsheet production software.